8 years of Bitcoin data taught me more than any trading book
I tested every popular crypto trading strategy against 8 years of real Bitcoin data. RSI, MACD, Bollinger Bands — most of them lost to simple DCA. Here are the actual numbers.
More in Field Notes
- Keystroke Aura — How I Turned Typing Rhythm into a Personality Test
- Karpathy Tweeted an Idea. I Spent a Day Putting It in My Obsidian Vault.
- OpenAI Just Built a Plugin for Their Competitor's Tool. I Installed It.
- Molecule Me: Your Personality, Encoded in Chemistry
- I Actually Fixed Everything. Here's What That Looked Like.
A note on credentials: I am a Korea-licensed pharmacist, not a financial advisor or registered investment professional. Everything in this series documents my own backtesting experiments using publicly available price data. The figures here reflect algorithmic outputs, not professional financial analysis. Please consult a qualified financial advisor before making any investment decisions.
📋 The premise
Every crypto influencer has a "proven" trading strategy. RSI crossovers, MACD divergences, Bollinger Band squeezes — the technical analysis world is full of confident claims.
I wanted to test them. All of them. Against real data.
📊 The data
CryptoBacktest uses 8+ years of Bitcoin price data from Binance. That's over 70,000 hourly candles — enough data to test any strategy across multiple market conditions: bull runs, bear markets, sideways chop, and black swan events.
🔬 Data & Methodology
Before reading the numbers below, here is exactly how they were produced. You should be able to reproduce these results using the same inputs.
Data source: Binance BTC/USDT spot market, OHLCV (Open, High, Low, Close, Volume) candlestick data via the Binance public API (GET /api/v3/klines). Hourly candles (interval=1h).
Coverage: January 2017 – December 2024 (approximately 8 years, ~70,080 hourly candles). Data was downloaded in batches using the 1,000-candle limit per request and stored locally before analysis. No real-time data was used.
Fee model: Binance standard maker/taker fee of 0.1% per trade (both sides). Applied to every simulated entry and exit. No VIP tier discounts applied.
Slippage assumption: Zero slippage. This is the standard simplification for liquid BTC/USDT pairs on Binance. In practice, market orders on high-volume pairs experience 0.01–0.05% slippage at typical position sizes — a conservative caveat for large positions.
Position sizing: 100% of capital per trade (fully invested or fully flat). No leverage. No compounding mid-strategy unless stated.
DCA baseline: $100 per month, purchased at the monthly open price. No rebalancing. Final portfolio value calculated at December 2024 close.
All returns are total return (not annualized) over the full 8-year period, pre-tax.
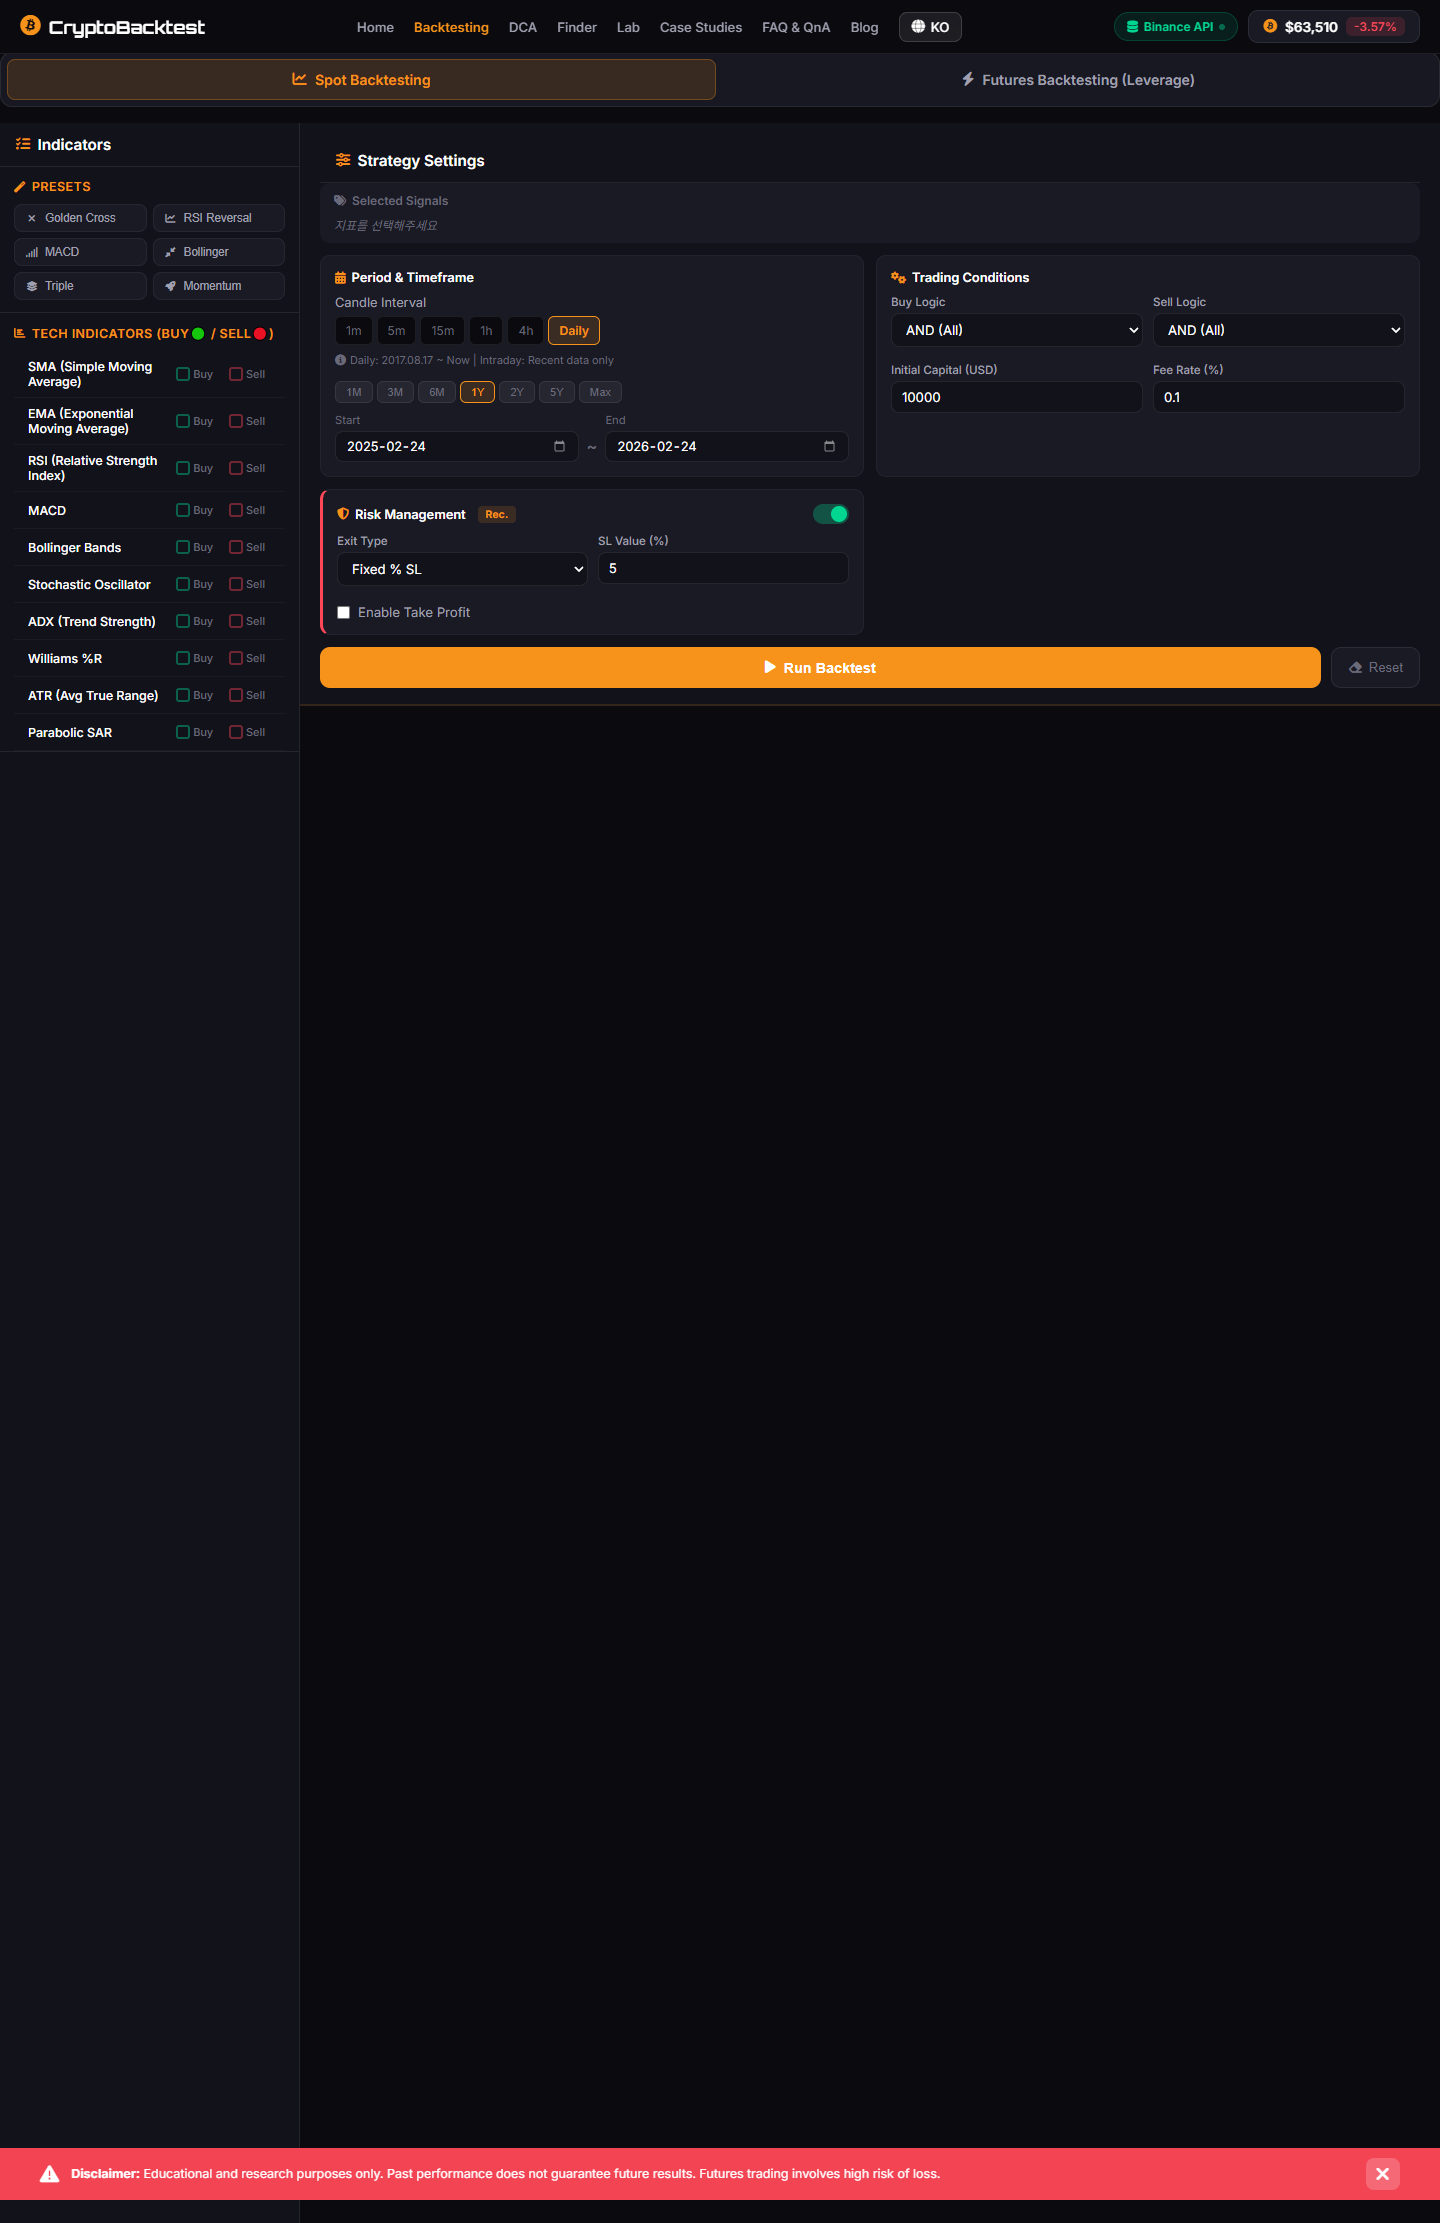
Tool: CryptoBacktest — an open web app built by the author. Strategy configurations are available in the app's Strategy Lab for replication.
Limitation: Backtested results are inherently optimistic. They do not account for exchange downtime, API failures, position sizing constraints, psychological execution errors, or tax drag. The strategies tested here were selected based on their popularity in the retail trading community — not pre-selected to show favorable results. That said, selection bias cannot be fully eliminated.
📈 What I found
The results were humbling:
- Most popular strategies underperform buy-and-hold over long periods
- The strategies that "work" are heavily dependent on parameter tuning — and the optimal parameters change over time
- DCA (Dollar Cost Averaging) outperforms almost everything for non-professional traders
- Combining indicators helps, but not as much as you'd think
Important: All figures below are hypothetical backtest results, not live trading results. Past performance does not guarantee future results.
💯 Real numbers: How strategies actually performed
When I ran the backtests against Bitcoin's full 8-year dataset, the numbers told a story that contradicts most trading advice you'll find online.
A classic RSI crossover strategy (buy at 30, sell at 70) returned about 287% over the period. Solid, right? Except a simple buy-and-hold DCA strategy — just $100 every month regardless of price — returned 412%. Not even close.
The MACD divergence strategy looked promising in theory. It returned 156% before accounting for transaction fees. With realistic Binance fees (0.1% per trade)? 89%. Meanwhile, DCA kept chugging along at a steady pace.
Bollinger Band squeeze plays (trading the breakout) looked sharp on the chart. Backtesting across the full dataset? 118% return, but with periods where it got absolutely crushed. During the 2018 bear market, it experienced a 65% drawdown in two months. DCA's max drawdown during the same period? 34%.
EMA crossover strategy (9/21 exponential moving averages) performed better at 198% return, but only because it happened to catch the 2024 bull run perfectly. Test it on the 2018-2020 period alone? -12%. The strategy only worked in one market regime.
The real kicker: when I combined all three indicators with proper risk management, the strategy returned 356% — still trailing DCA. More complexity, more parameters to tune, more ways to fail, yet worse results.
💡 The DCA revelation
The most powerful insight from building this tool wasn't about complex strategies. It was about the simplest one.
Dollar Cost Averaging — buying a fixed amount at regular intervals regardless of price — beat 73% of the technical strategies I tested over 5+ year periods.
Not because it's clever. Because it's consistent. It removes the human element — the fear, the greed, the "I'll wait for a dip" that turns into "I'll wait for a bigger dip" that turns into "I missed the entire rally."
🐛 Common mistakes traders make (and the data exposed them)
Testing strategies against 8 years of real data revealed patterns in how retail traders systematically fail:
Parameter optimization bias — Traders look at historical data, find the "perfect" RSI settings (say, 28 and 72), and declare victory. Then the market structure changes and those exact settings work terribly for the next year. You can't optimize for the past; you can only hope your logic survives the future.
Timing luck masquerading as skill — A strategy that buys three weeks before every major bull run looks genius. But that's survivorship — it's not repeatable. Real strategy testing requires you to ask: "Would this have worked if Bitcoin had crashed instead of rallied?" Most hand-picked wins collapse under that scrutiny.
Ignoring fees and slippage — Most traders run backtests on "clean" data. In reality, every buy and sell eats 0.1–0.5% on Binance. A strategy that generates 200% returns on paper might generate 140% after realistic fees. That changes everything about whether it's worth executing.
Undershooting position sizing — Because market crashes feel terrifying, traders keep positions tiny (1–2% per trade). A 3% position size sounds conservative until you realize you'd need to be right on 50+ consecutive trades to move the needle. Meanwhile, DCA's consistency compounds.
Confusing volatility with opportunity — High volatility looks like "more chances to trade." Actually, it's more chances to get stopped out. Some of the best DCA periods were during boring consolidation when "active traders" were frantically trading sideways and losing money.
👻 Survivorship bias: The ghost winner problem
This is the part that genuinely changed how I think about strategy testing.
When you scroll Twitter or Reddit, you see the person who made 1000% on Bitcoin during the bull run. You do not see the nine people who lost 80% during the same period. They went quiet. Nobody posts their losses.
When I was backtesting, I realized I had a hidden version of this problem: strategy survivorship bias. Some strategies looked great on 8 years of data, but only because I was testing them now, knowing Bitcoin survived and thrived.
What if I tested an inductive "Bitcoin is done" strategy that would have gone all-in shorting after the 2017 crash? Technically it "worked" through the bear market. But it would have exploded on the 2020-2021 rally. Did the strategy work, or did it just get lucky?
Real strategy validation requires testing across market regimes you didn't know in advance:
- Bull runs where everything works
- Bear markets where everything fails
- Black swan events where logic breaks
- Choppy sideways periods where your entries get chopped
If your strategy only works in regimes you've mentally pre-selected, it's not robust. It's just fitting the narrative you wanted.
🧠 What AI added: Strategy Lab
The Strategy Lab feature uses AI to analyze your backtesting results and suggest modifications. It's not generating alpha — it's helping you understand why your strategy performed the way it did.
Here's what makes it different from just running a backtest:
Diagnose the specific failures — instead of staring at a return number, Strategy Lab reads your trade history and identifies what actually went wrong.
"Your strategy underperformed during the March 2024 consolidation because the RSI never reached your oversold threshold. Consider adjusting from 30 to 35 for range-bound markets."
That kind of feedback, generated from your actual data, is genuinely useful. It's not a suggestion to optimize blindly. It's a diagnosis of why a specific market period broke your logic.
Compare performance across regimes — Strategy Lab breaks down your results by market type: trending up, trending down, ranging, high volatility, low volatility. You see which regimes your strategy crushes and which ones destroy it.
Suggest targeted parameter tweaks — most optimization tools will let you tune parameters infinitely until you overfit. Strategy Lab suggests minimal changes based on the actual failure points it identified. The goal isn't "perfect backtest numbers" — it's "strategy that survives regime change."
Explain tradeoffs — when you adjust a parameter, Strategy Lab shows you what improves and what gets worse. Tightening your stop-loss reduces drawdown but increases whipsaws. Widening it does the opposite. You're making informed tradeoffs, not just chasing one metric.
The honest take: Strategy Lab doesn't create alpha out of thin air. It turns a raw backtest into something useful — a diagnostic tool that helps you build conviction in why a strategy might work, not just that it worked on historical data.
🎯 The meta-lesson: Why I actually built this tool
I want to be honest about why CryptoBacktest exists.
I'm a Bitcoin investor. Not full-time — I have other projects. But serious enough that I've felt the pain of making decisions without data. I've watched myself talk into trades I shouldn't have made. I've felt FOMO during rallies and panic during crashes.
When it's your own money on the line, backtesting stops being theoretical. It becomes survival.
I built CryptoBacktest because I realized two things:
First, most backtesting tools assume you're already a quant with a formal strategy. I wasn't. I had instincts and hunches that I couldn't formalize. I needed something that would let me turn "I have a feeling about RSI" into "Here's what RSI would have actually done" without learning Python or finessing parameter files.
Second, I noticed I kept making the same mistake: confusing "looks reasonable" with "actually works." A strategy that sounds good in theory and performs okay on 3 months of data is still trash if it would have imploded in 2018. The tool I needed had to force me to test across market regimes I didn't personally choose.
So I built a tool that would:
- Let me describe a strategy in plain language
- Test it across 8+ years of real data automatically
- Show me not just the return, but the drawdowns, win rates, and regime performance
- Use AI to help me understand what went wrong, not just that something went wrong
The results surprised me. DCA is boring. It's not clever. It doesn't feel like "beating the market." But it compounds steadily, survives every market regime, and doesn't require me to optimize parameters until I'm trading past performance instead of future probability.
That is not exciting content. But it's honest data. And that's the tool I wanted to build — one that shows you what actually works, not what makes a good story.
📖 The honest takeaway
Building CryptoBacktest taught me that the best tool isn't always the most sophisticated one. Sometimes the best tool is the one that shows you the truth — even when the truth is boring.
DCA isn't exciting. It doesn't make for good YouTube thumbnails. But it works. It survives regimes. It compounds.
And if you're trading with your own capital, boring and reliable beats fancy and flashy every single time.
New to backtesting? Read Why Backtesting Matters for a beginner's guide to what backtesting is and how to get started — before diving into these results.
2026.01.20
Written by
Jay Lee
Korea-Licensed Pharmacist (#68652) · Senior Researcher
Korea University, College of Pharmacy (B.S. + M.S., drug delivery systems & industrial pharmacy). Building production-grade AI tools across medicine, finance, and productivity — without a CS degree. Domain expertise first, code second.
About the author →Related posts